What students practice
The mean starts as evening out cube towers, then as adding the values and sharing them equally. Students decide whether a question is statistical and whether data is categorical or numerical, read and make dot plots, read and draw a bar graph, and read histograms and box plots. They describe a distribution as symmetric, skewed left, or skewed right, and count each value's distance from the mean.
What's inside
- p. 3
Even It Out
Even out the towers so they are all the same height, then write the equal share.
- p. 4
Add, Then Share
Find the total, then share it equally to find the mean.
- p. 5
Mean Code
Find each mean, then find it in the code bank and write its letter.
- p. 6
Questions and Data
Decide if each question is statistical, then if each data set is categorical or numerical.
- p. 7
Read a Dot Plot
Use each dot plot to answer the questions.
- p. 8
Make a Dot Plot
Make a dot plot of each data set, then answer the questions.
- p. 9
Bar Graphs
Read the first bar graph, then draw the second one from its table.
- p. 10
Read a Histogram
Use each histogram to answer the questions.
- p. 11
Read a Box Plot
Use each box plot to answer the questions.
- p. 12
Describe the Shape
Choose the word for each shape, then select all the true statements.
- p. 13
Distance From the Mean
Count how far each dot is from the mean, then compare the sets.
- p. 14
Mixed Review
Solve each problem, then check your work.
Think: with towers of 2, 6, and 4, move 2 cubes from the 6 to the 2; each has 4.
Georgia standards covered
6.NR.2.1
Describe and interpret the center of the distribution by the equal share value (mean).
In this packet: pages 3 to 5 and 14. 6.NR.2.1 practice in all our packets
6.NR.2.2
Summarize categorical and quantitative (numerical) data sets in relation to the context: display the distributions of quantitative (numerical) data in plots on a number line, including dot plots, histograms, and box plots and display the distribution of categorical data using bar graphs.
In this packet: pages 6 to 11 and 14. 6.NR.2.2 practice in all our packets
6.NR.2.3
Interpret numerical data to answer a statistical investigative question created. Describe the distribution of a quantitative (numerical) variable collected, including its center, variability, and overall shape.
In this packet: pages 6 to 8 and 12 to 14. 6.NR.2.3 practice in all our packets
Who it's for
Grade 6 classes starting statistics. Students build dot plots and one bar graph. Histograms and box plots are for reading only, and the interquartile range is not computed. Statistics B is the later half of this unit.
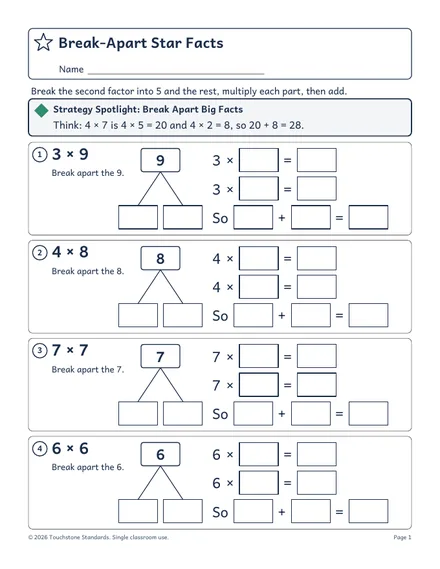 See the format first, free. Our free Grade 3 sample, Break-Apart Star Facts, shows the same page layout and answer key style.