
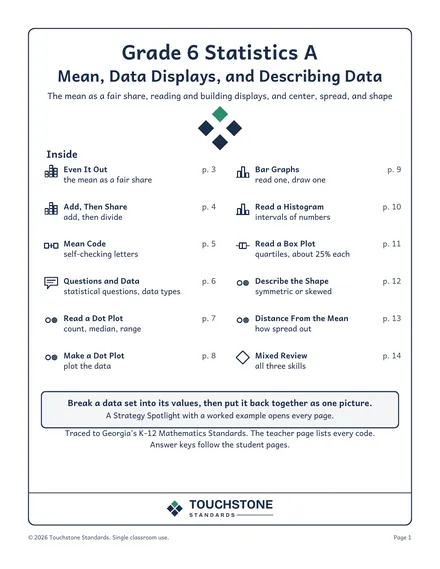
- p. 6Questions and Data. Decide if each question is statistical, then if each data set is categorical or numerical.
- p. 7Read a Dot Plot. Use each dot plot to answer the questions.
- p. 8Make a Dot Plot. Make a dot plot of each data set, then answer the questions.
- p. 12Describe the Shape. Choose the word for each shape, then select all the true statements.
- p. 13Distance From the Mean. Count how far each dot is from the mean, then compare the sets.
- p. 14Mixed Review. Solve each problem, then check your work.
The standard
Interpret numerical data to answer a statistical investigative question created. Describe the distribution of a quantitative (numerical) variable collected, including its center, variability, and overall shape.
Element 6.NR.2.3 of Georgia's K-12 Mathematics Standards (2021, effective SY2023-24), in the Numerical Reasoning strand. It sits under standard 6.NR.2: Apply operations with whole numbers, fractions and decimals within relevant applications.
What students practice
Students decide whether a question is statistical, find a median and a range from a dot plot, describe a distribution as symmetric, skewed left, or skewed right, and count each value's distance from a marked mean. The interquartile range is not computed.
Where to find it
Think: the heights of 25 students vary, so asking about them is statistical.