What students practice
Students read and make pictographs where one symbol stands for more than one, read and draw bar graphs whose bars always end on a grid line, and read and make whole-number dot plots. Later pages ask how many more, how many fewer, and how many in all in one and two steps, match a table to its graph, choose a key or scale that fits the data, and finish with students writing and answering their own question about a graph.
What's inside
- p. 3
Read a Pictograph
Use the pictograph and its key to answer each question.
- p. 4
Make a Pictograph
Write the number for each tally, then draw circles to finish the pictograph.
- p. 5
Read a Bar Graph
Read the bar graph, then answer each question.
- p. 6
Draw the Bars
Draw a bar for each room on the graph, then answer the questions.
- p. 7
More, Fewer, In All
Read the bar graph, then solve each problem.
- p. 8
Read a Dot Plot
Use the dot plot to answer each question.
- p. 9
Make a Dot Plot
Draw one dot for each number in the list, then answer the question.
- p. 10
Choose a Key or Scale
Choose a key or a scale that fits the data.
- p. 11
Which Graph Matches?
Circle the graph that matches the table.
- p. 12
Pictograph Story
Use the pictograph to solve each problem.
- p. 13
Ask Your Own Question
Answer the questions, then write and answer your own question.
- p. 14
Mixed Review
Read each graph, then answer the questions.
Think: each diamond is 2 votes, so 7 diamonds is 7 × 2 = 14 votes.
Georgia standards covered
3.MDR.5.1
Ask questions and answer them based on gathered information, observations, and appropriate graphical displays to solve problems relevant to everyday life.
In this packet: pages 3 to 14. 3.MDR.5.1 practice in all our packets
Who it's for
Grade 3 classes on the data element, and families who want graph reading that leans on multiplication facts: a pictograph key of 2, 5, or 10 turns every row into a fact to use. There are no half symbols to read.
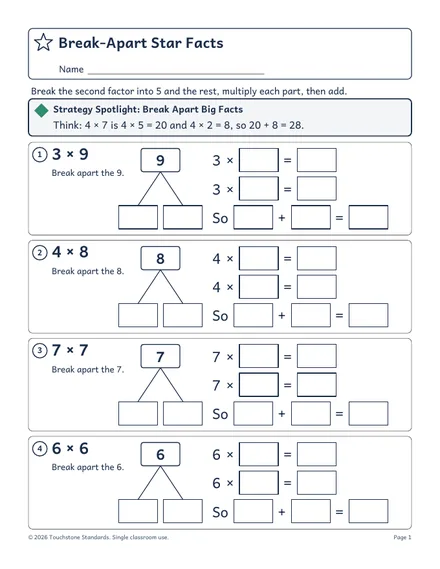 See the format first, free. Break-Apart Star Facts is four Grade 3 pages with an answer key.