
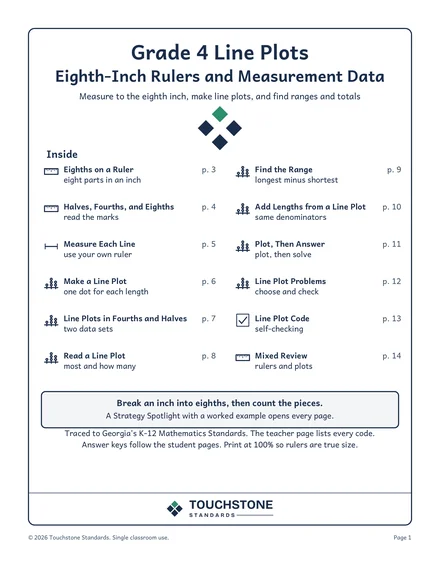
- p. 3Eighths on a Ruler. Read the ruler to find how long each object is, to the nearest eighth inch.
- p. 4Halves, Fourths, and Eighths. Read each ruler to the nearest half, fourth, or eighth inch, as the problem asks.
- p. 5Measure Each Line. Use an inch ruler to measure each line to the nearest eighth inch.
- p. 6Make a Line Plot. Make a line plot of the data, then use it to answer the questions.
- p. 7Line Plots in Fourths and Halves. Make a line plot for each set of data, with one dot for each length.
- p. 9Find the Range. Use the line plot to find the range: the longest minus the shortest.
- p. 10Add Lengths from a Line Plot. Use the line plot to add lengths that have the same denominator.
- p. 11Plot, Then Answer. Make the line plot, then use it to answer the questions.
- p. 12Line Plot Problems. Use the line plot to answer each question.
- p. 14Mixed Review. Read each problem, then solve.
The standard
Create dot plots to display a distribution of numerical (quantitative) measurement data.
Element 4.MDR.6.3 of Georgia's K-12 Mathematics Standards (2021, effective SY2023-24), in the Measurement & Data Reasoning strand. It sits under standard 4.MDR.6: Measure time and objects that exist in the world to solve real-life, mathematical problems and analyze graphical displays of data to answer relevant questions.
What students practice
Students measure to the nearest half, fourth, and eighth inch on true-size rulers and with their own ruler, then make line plots from data tables with one dot for each length. They find the range and the total of two lengths by subtracting or adding like denominators.
Where to find it
- p. 5Eighths on a Ruler. Read the ruler to find how long each object is, to the nearest eighth inch.