
What students practice
Students put a list in order and find the median and range, split it into halves for Q1, Q3, and the interquartile range, then draw a box plot from the five-number summary on a labeled number line. They compare two groups' box plots, choose a fair test and make a prediction from its data, spot the value far from the rest, and choose the mean or the median from the shape of the data. Then one value is added or removed, and students redraw the box plot or dot plot and say how the mean and the median changed, with a self-checking code page and a Mixed Review.
What's inside
- p. 3
Median and Range
Find the median and the range of each data set.
- p. 4
Quartiles and IQR
Find the quartiles, the median, and the IQR of each data set.
- p. 5
Make a Box Plot
Find the five-number summary, then draw the box plot on the number line.
- p. 6
Compare Two Box Plots
Use the two box plots to compare the teams.
- p. 7
Experiments and Predictions
Use the experiment to find the measures, then draw conclusions.
- p. 8
Spot the Outlier
Choose the outlier, the value far from the rest, in each data set.
- p. 9
Choose the Best Measure
Choose the measure that best describes each data set.
- p. 10
Add or Remove a Value
Find the mean and the median before and after each change.
- p. 11
Box Plots Before and After
Draw the box plot after the change, then find the new median and IQR.
- p. 12
Dot Plots Before and After
Make a dot plot of each data set, then answer the questions.
- p. 13
Quartile Code
Find each answer, then find it in the code bank and write its letter.
- p. 14
Mixed Review
Solve each problem, then check your work.
Think: 9, 4, 7, 2, 6 in order is 2, 4, 6, 7, 9; the middle value, 6, is the median.
Georgia standards covered
6.NR.2.4
Design simple experiments and collect data. Use data gathered from realistic scenarios and simulations to determine quantitative measures of center (median and/or mean) and variability (interquartile range and range). Use these quantities to draw conclusions about the data, compare different numerical data sets, and make predictions.
In this packet: pages 3 to 7 and 12 to 14. 6.NR.2.4 practice in all our packets
6.NR.2.5
Relate the choice of measures of center and variability to the shape of the data distribution and the context in which the data were gathered.
In this packet: pages 8, 9, and 14. 6.NR.2.5 practice in all our packets
6.NR.2.6
Describe the impact that inserting or deleting a data point has on the mean and the median of a data set. Create data displays using a dot plot or box plot to examine this impact.
In this packet: pages 10 to 14. 6.NR.2.6 practice in all our packets
Who it's for
Grade 6 classes in the second half of the statistics unit, after Statistics A. Quartiles are the medians of the lower and upper halves, and every measure is a whole number or ends in .5. Outliers are found by eye, with no formula. Students need a ruler for the box plot pages. No mode, mean absolute deviation, or probability.
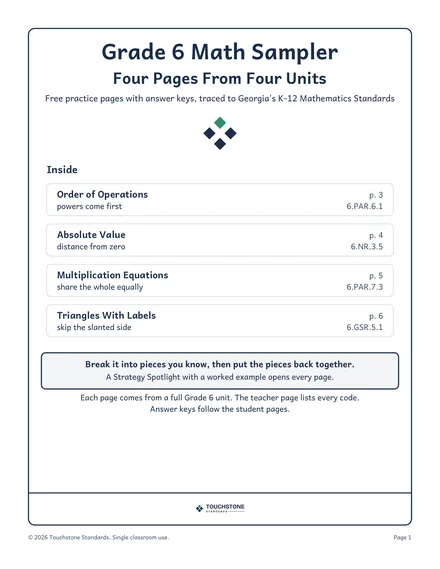 See the format first, free. The free Grade 6 Math Sampler has one practice page from four units, each with its answer key.
More Grade 6 packets
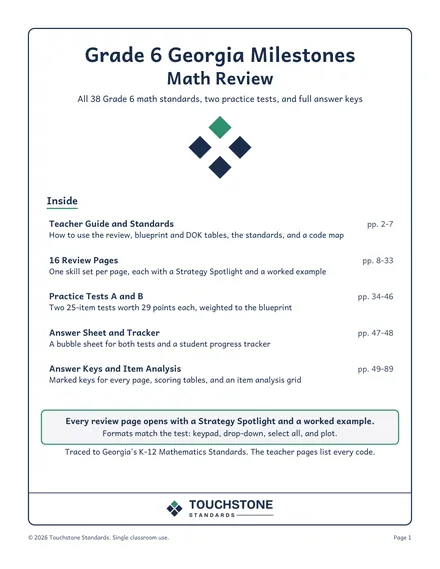 Milestones Math Review: 16 Review Sets and 2 Practice Tests6.NR.1.1 · 6.NR.1.2 · 6.NR.1.3 · 6.NR.2.1 · 6.NR.2.2 · 6.NR.2.3 · 6.NR.2.4 · 6.NR.2.5 · 6.NR.2.6 · 6.NR.3.1 · 6.NR.3.2 · 6.NR.3.3 · 6.NR.3.4 · 6.NR.3.5 · 6.NR.3.6 · 6.NR.4.1 · 6.NR.4.2 · 6.NR.4.3 · 6.NR.4.4 · 6.NR.4.5 · 6.NR.4.6 · 6.NR.4.7 · 6.GSR.5.1 · 6.GSR.5.2 · 6.GSR.5.3 · 6.PAR.6.1 · 6.PAR.6.2 · 6.PAR.6.3 · 6.PAR.6.4 · 6.PAR.6.5 · 6.PAR.7.1 · 6.PAR.7.2 · 6.PAR.7.3 · 6.PAR.7.4 · 6.PAR.8.1 · 6.PAR.8.2 · 6.PAR.8.3 · 6.PAR.8.4
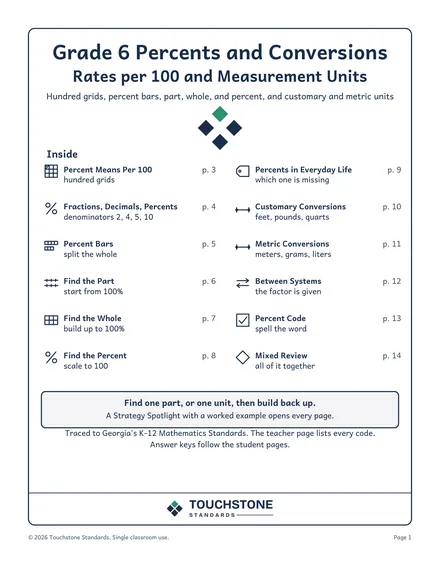 Percents and Conversions: Rates per 100 and Measurement Units6.NR.4.6 · 6.NR.4.7
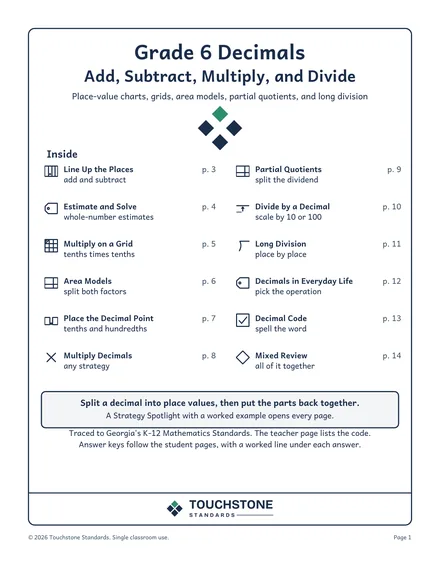 Decimals: Add, Subtract, Multiply, and Divide6.NR.1.3